FLUX

Expense management and consumption monitoring in real-time

ROLE
UX/UI
DURATION
6 weeks, 2021-2022

OVERVIEW

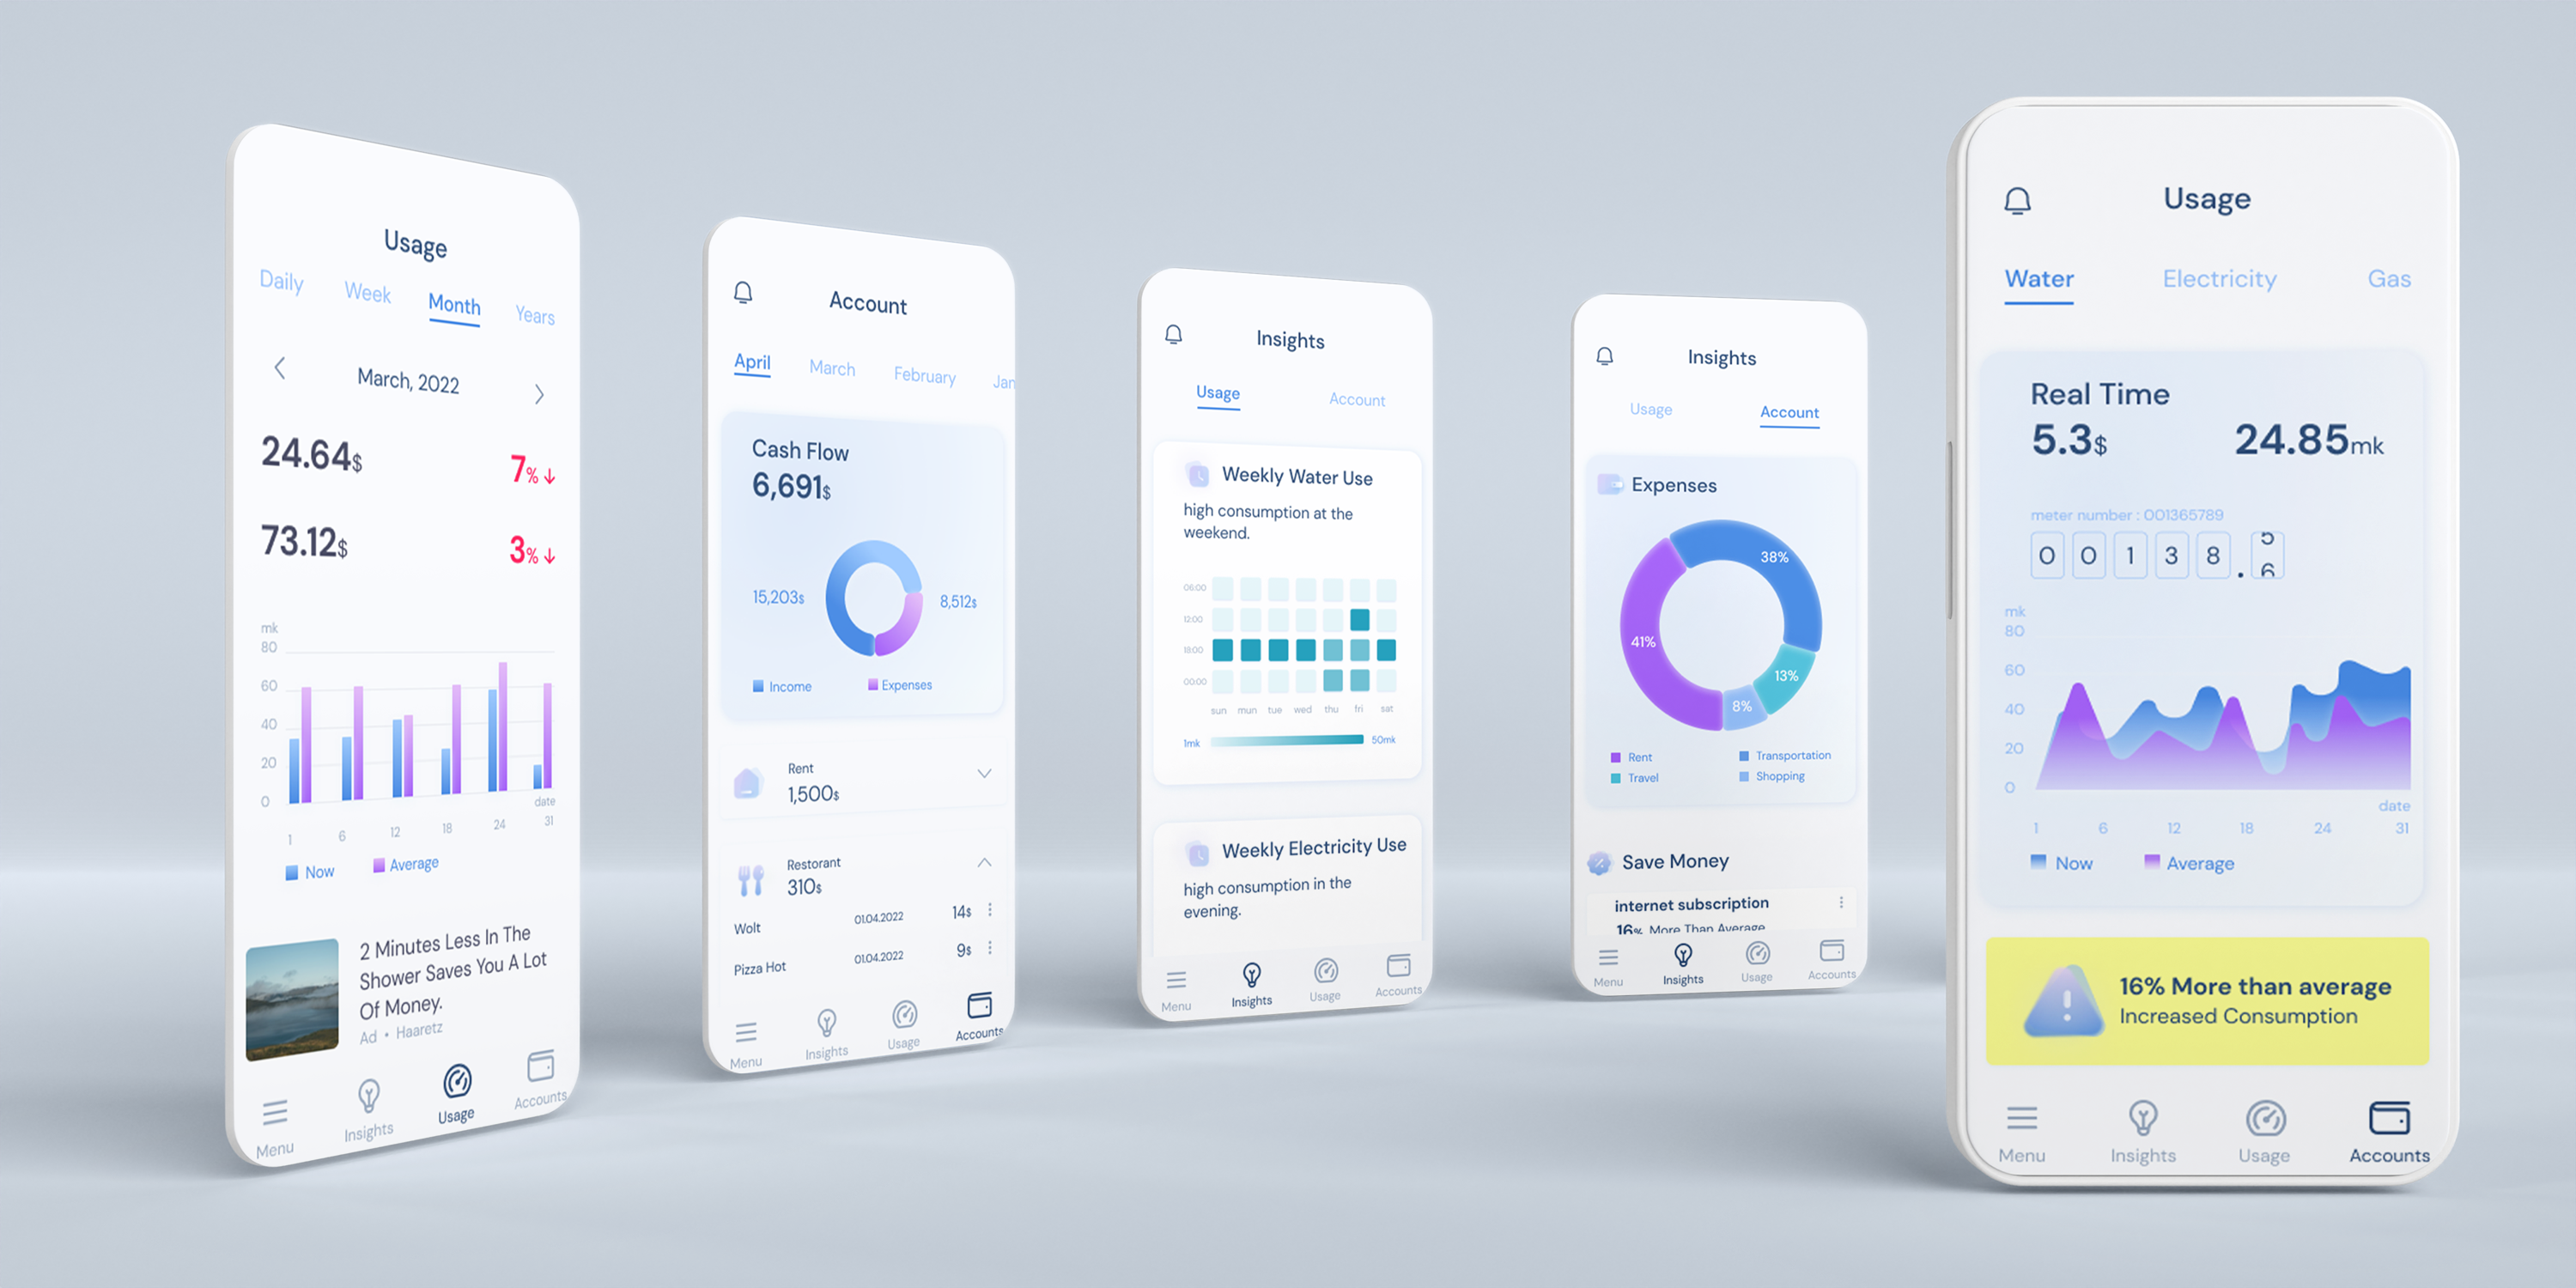
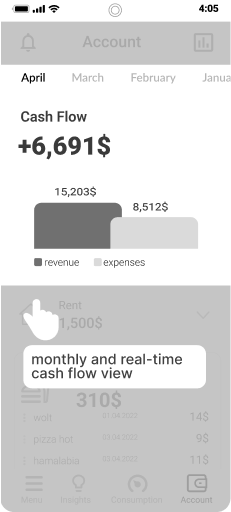
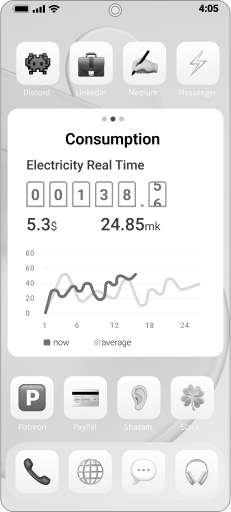
Monitoring electricity, water, gas and current expenses of the property in real-time from all bank accounts and credit cards.

One place for all credit cards and account expenses.
Monitoring energy consumption and abnormalities in real-time

Challenges

Accounts and consumption are
spread across different apps and platforms.
|
System alerts are not sent to the user in real-time.
|
There is no way to detect a problem in real-time when consumption reports are sent every two months.
|
Current expenses are out of control.
|
Detecting and treating the problem in late stages can lead to much damage.

solutions

Concentration of finance and energy consumption interfaces in one place.
Display data and alerts in real-time
User data analysis for a better understanding of financial expenses and energy consumption.

values

All in one app
All charges and expenses in on place.
Real-time control
Tracking usage and expenses.
Maximum security
Highest security according to the cyber standard.

Competitive Analysis

Testing different markets:
Financial management programs, interfaces for green invoices, apps for a smart home.
|
Information mirroring and security in the onboarding process with the user.
|
Simple and clear information display (no need to read between the lines).
|
Simple division into topics / areas.
|
A simple and easy-to-read infographic.

User research

|
The information is scattered in several sources: papers, bank, credit cards and memos.
|
There is no real-time tracking of expenses and consumption.
|
"If only we could detect the problem at the right time".
|
Comparison of consumption and payments for similar expenses of other users.

User flow

Onboarding

|
Create a new account or use one from an existing platform.
|
Connect a bank account for displaying and sorting expenses.
|
Credit card synchronization to display current expenses
|
View-only permission for energy consumption accounts.

wireframe

Immediately after onboarding, there is an option of coach marks to explain how to use the app.
Account page.
View account status and a breakdown of expenses by subject.
Additional actions to edit each expense to make it more accurate.
Consumption page.
Infographics of different times based on the user's choice.
Alerts display abnormal consumption or lack of user permissions for real-time data viewing.

wireframe

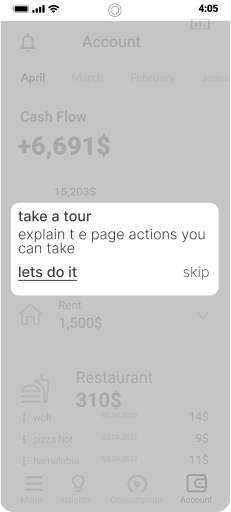
Immediately after onboarding, there is an option to coach marks to explain how to use the application.
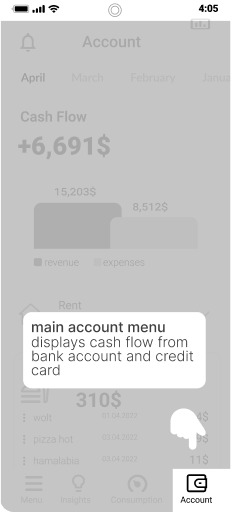
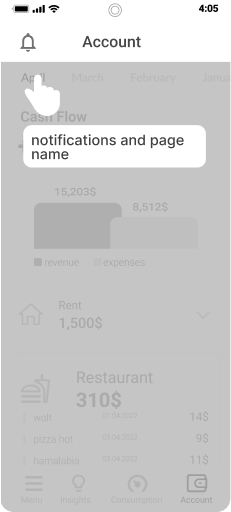
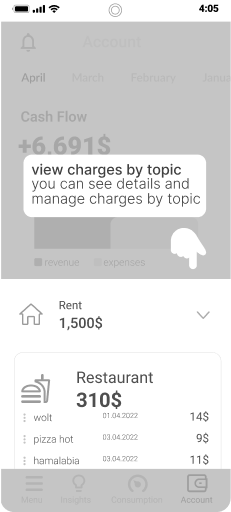
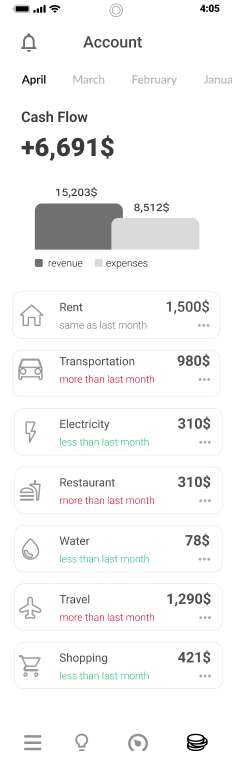
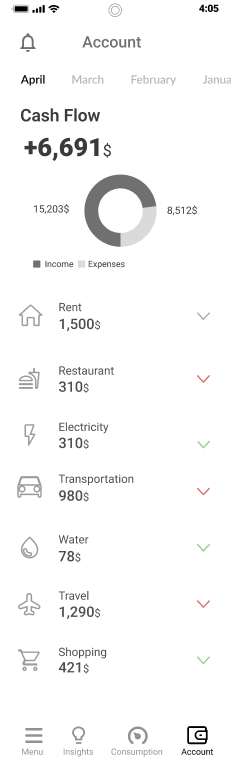
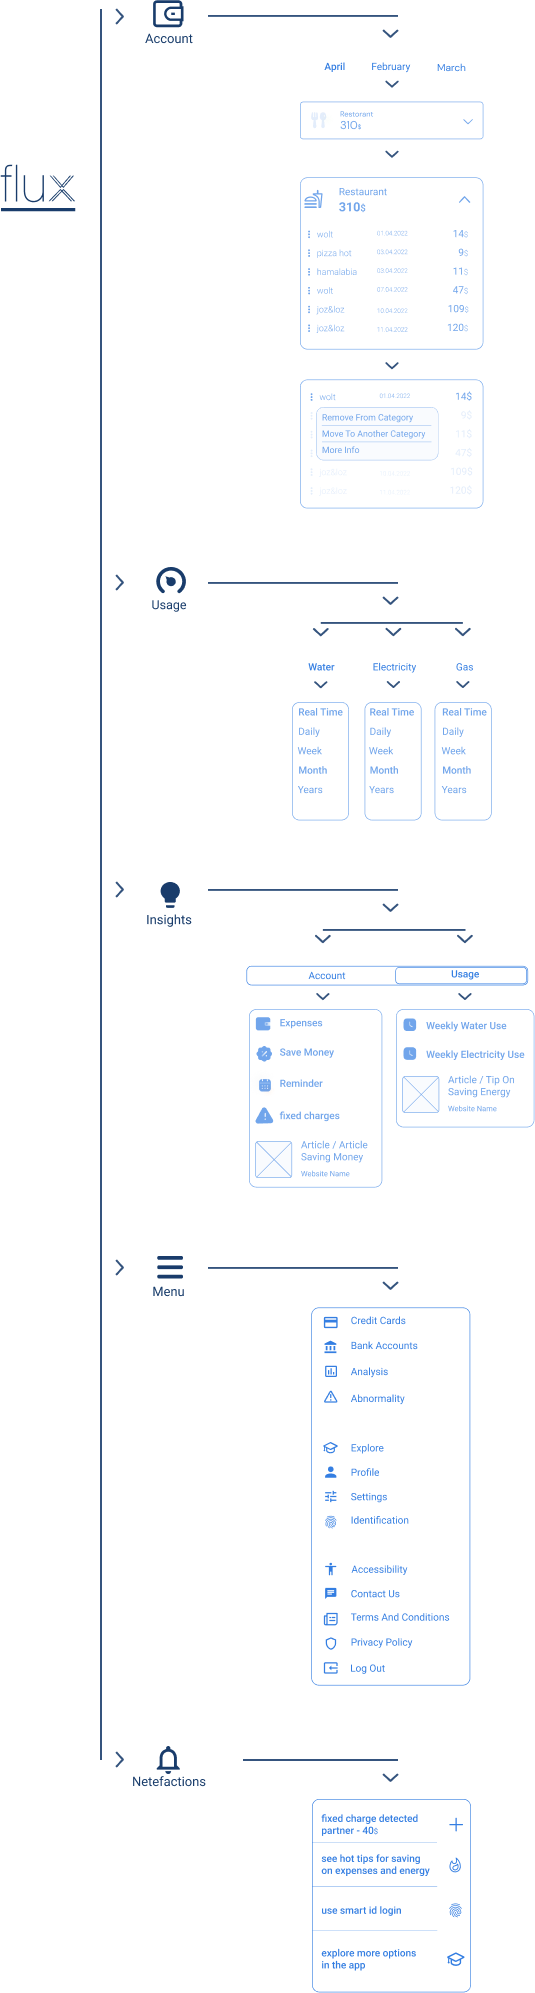
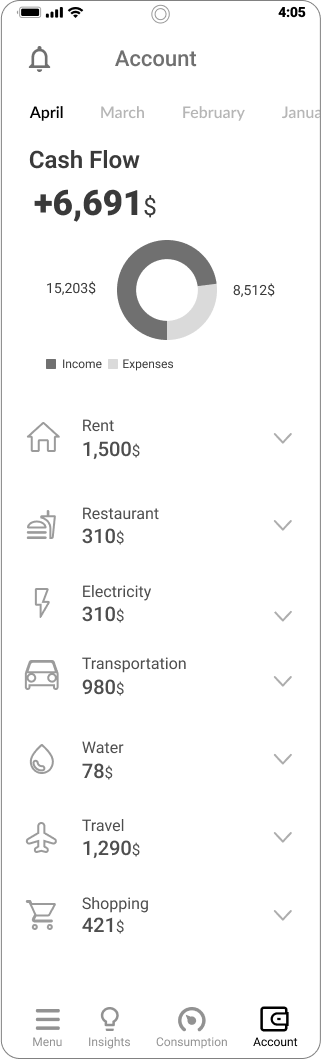
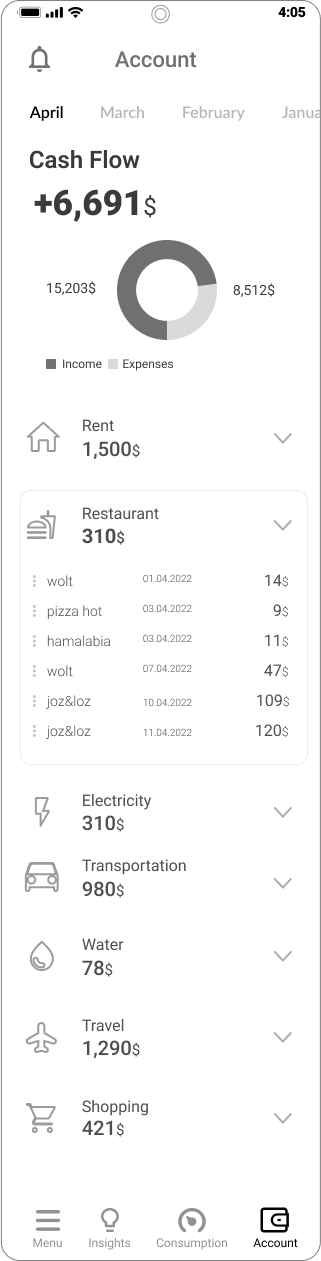
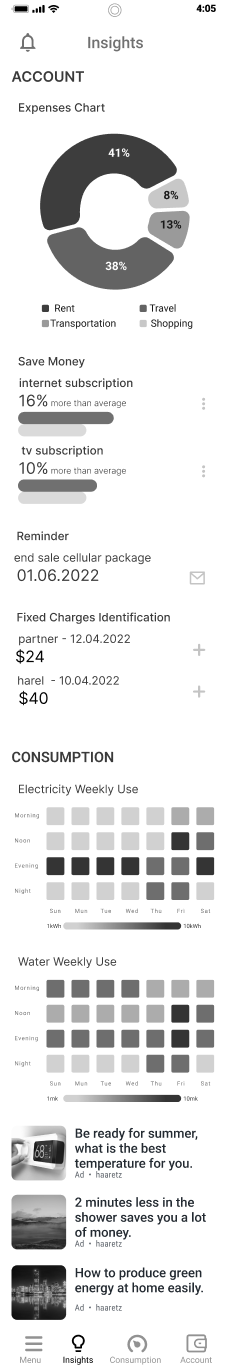
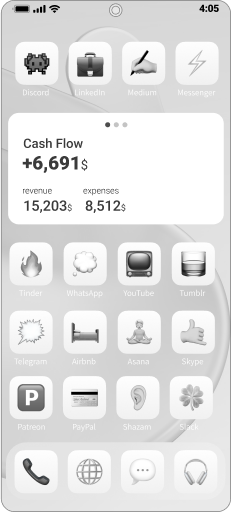
Account page
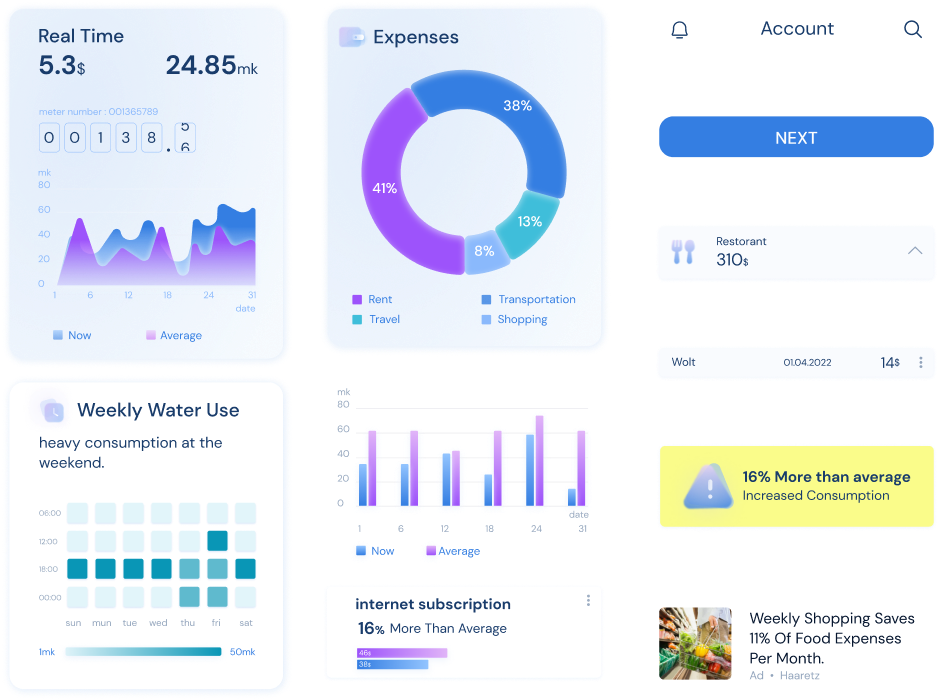
View account status segmentation of expenses by subject.
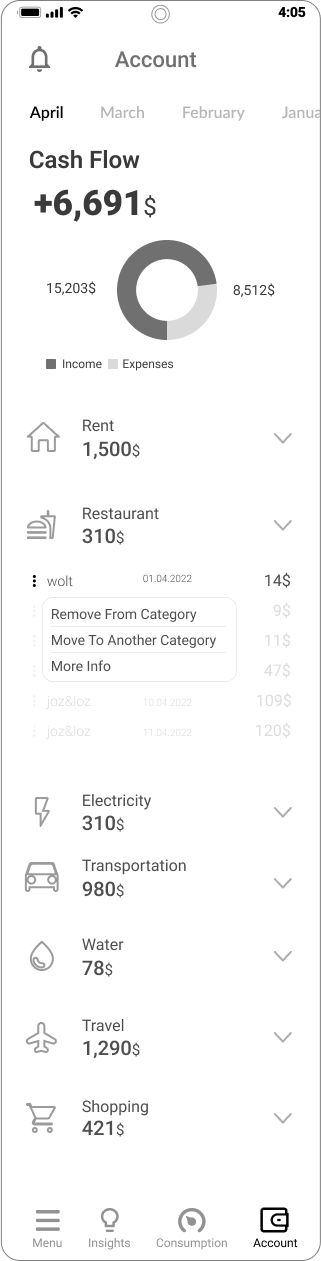
Perform additional actions for each expense and make it more accurate.
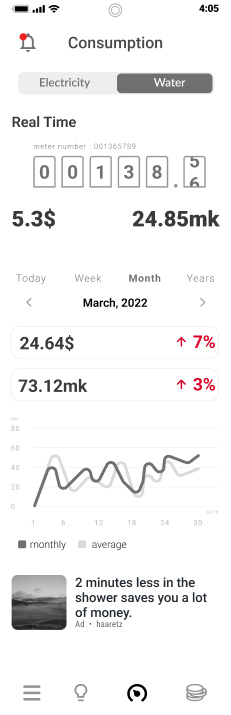
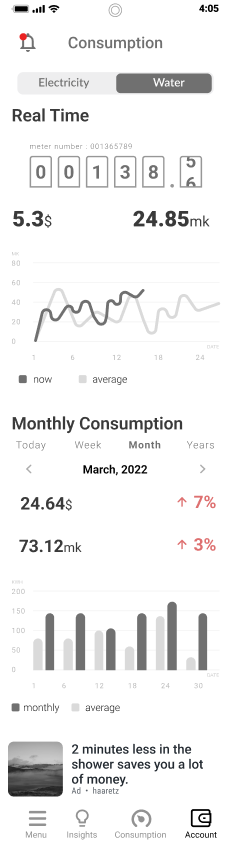
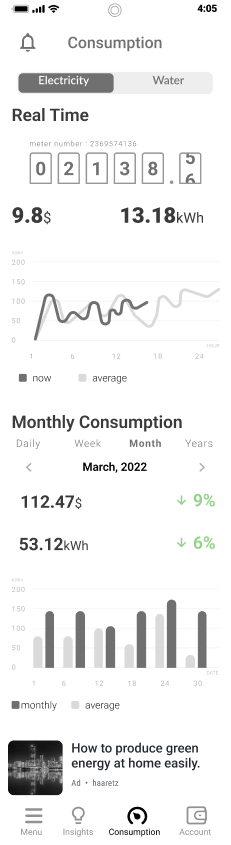
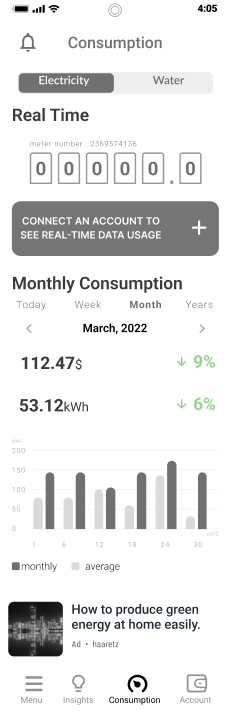
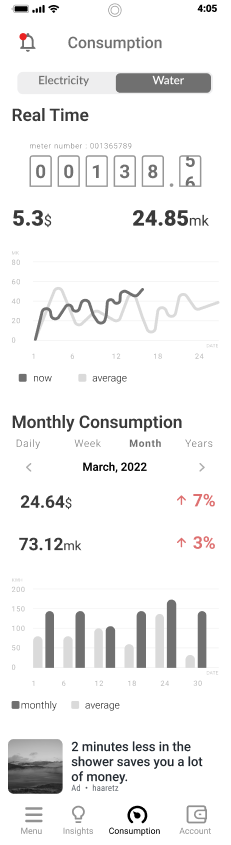
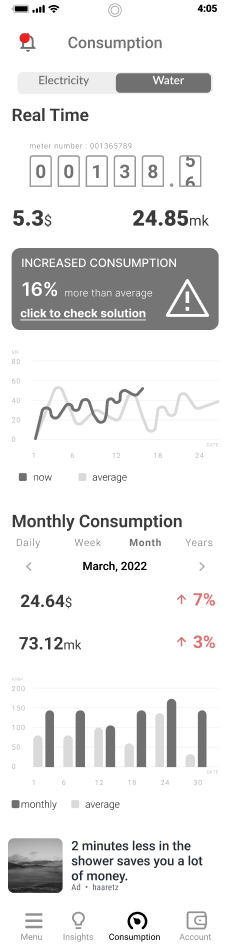
Consumption page
Graph segmentation for different times based on the user's choice.
Displaying alerts such as abnormal consumption or connecting to an account for real-time data viewing.
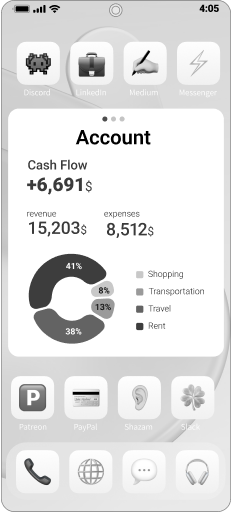
insights page
Providing users with conclusions and summaries of their financial expenses and energy consumption.

Widgets
Quick view of the data important to the user.
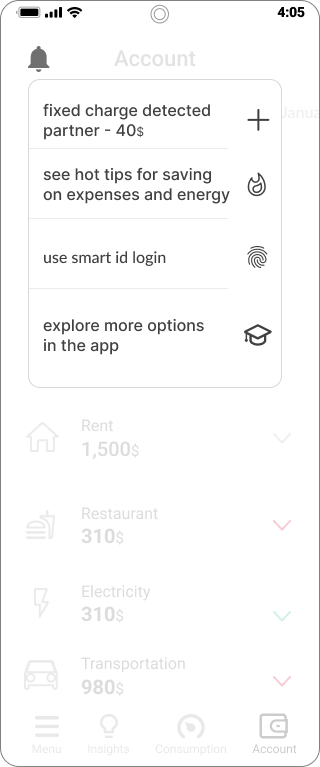
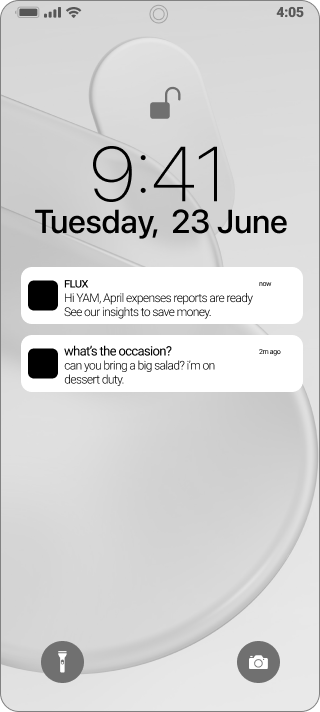
Netefactions
Data summaries or abnormal data are displayed with a brief explanation.
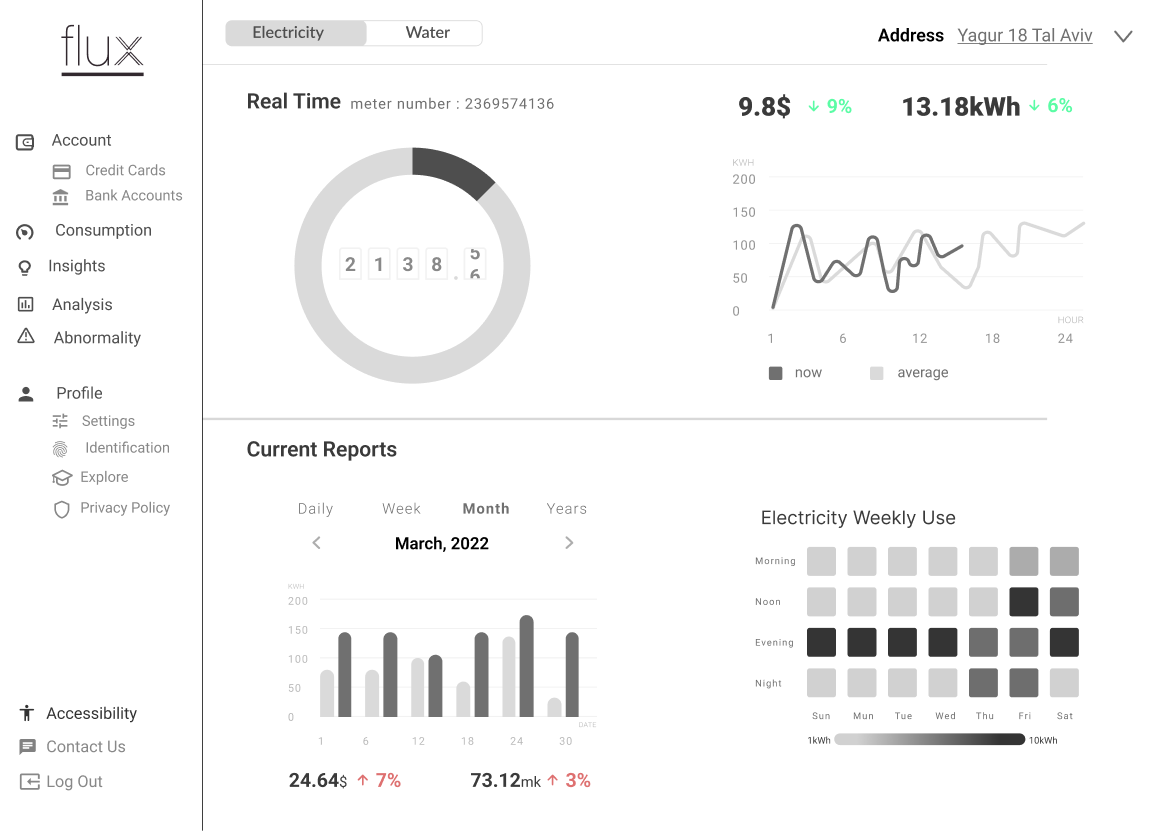
system
A future option for a desktop system
For multi-property use.

TESTING

Changing the account status graph into a clear one.Reducing information in your head to the main thing.Change menu, icons and texts.
Redistribution of information and more accurate graphical display
Making the account status graph clearer.
Simplfying the information shown to the user.
Changing the menu, icons and text.
A more accurate graphical display and proper redistribution of information.

Design System

Final UI Designs

download CV

adamdahir@gmail.com

+972-549080089

© 2022, Adam Dahir

^